Julebrus test 2021
This year we have executed probably the biggest Julebrus test in the family.
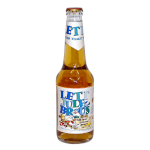
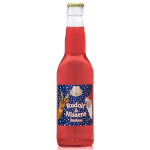
We collected about 17 different Julebrus from the stores, got together with the family and tried all of them.
There were the contestants:
|
[n.a.] |
|
|
|
|
[n.a.]
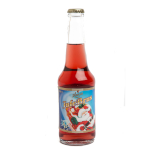
:alt: Ball Julebrus (rød) [07] |
|
|
|
|
|
|
|
|
|
|
The test conditions
The test was setup as a half-blind test (as blind as you can test with children and limited resources.
We ran two test rounds with 17 Christmas-Soda/Julebrus.
All soda were chilled outside a -9°C for two hours.
The soda then were evenly distributed into 2 times 17 paper cups and their position mixed. Each cup had a number under their bottom which at the end would reveal which brand they came from.
The test subjects were two grown ups and two children (age six and three). For a less biased testing result one of the adults did not grow up with this kind of soda, while the other one did.
We then started tasting randomly each cup and lined them up in the order of taste: from bad to good.
Re-tasting for comparison was obviously allowed in order to be able to put the cups into the right position.
When all 17 cups of round had been tasted and sorted, the numbers would be written down and a new round began.
The result
The result after to testing rounds are listed in the table below.
Rank |
Test 1 |
Test 2 |
|---|---|---|
01 |
Romas Brune Julebrus [05] |
Ringnes Julebrus (Dahls) [12] |
02 |
Hamar Julebrus, lett [06] |
Hamar Julebrus, lett [06] |
03 |
Egge Julebrus [15] |
Romas Brune Julebrus [05] |
04 |
Romas Røde [09] |
Egge Julebrus [15] |
05 |
Hamar Julebrus, lett [06] |
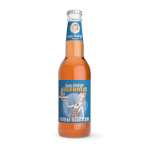
Oskar Sylte, Rudolf & Nissens Julebrus [10] |
06 |
Grans Julebrus X [17] |
Romas Røde [09] |
07 |
Ringnes Julebrus (Dahls) [12] |
Aass Julebrus [13] |
08 |
Oskar Sylte, Rudolf & Nissens Julebrus [10] |
Ball Julebrus, sukkerfri [02] |
09 |
Aass Julebrus [13] |
Hansa Julebrus [01] |
10 |
Ball Julebrus, sukkerfri [02] |
Hamar Julebrus, lett [06] |
11 |
Ringnes Julebrus - god Jul, rød [14] |
Aass Julebrus, Sukkerfri [04] |
12 |
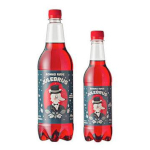
Ball Julebrus (rød) [07] |
Romas Røde Julebrus, sukkerfri [16] |
13 |
Hansa Julebrus [01] |
Ball Julebrus (rød) [07] |
14 |
Hansa Julebrus, Lett [03] |
Grans Julebrus X [17] |
15 |
Romas Røde Julebrus, sukkerfri [16] |
Tante Hedvigs Julebrus, sukkerfri [08] |
16 |
Aass Julebrus, Sukkerfri [04] |
Ringnes Julebrus - god Jul, rød [14] |
17 |
Tante Hedvigs Julebrus, sukkerfri [08] |
Hansa Julebrus, Lett [03] |
Details
Variances between the tests
With such a low amount of data (two tests in total) let’s have a look into the variance of results per soda between the tests. They should end up close to each result, independent of the test.
While the actual test-round might have had an effekt on the result based on the prior tests, the deviation should be too big.
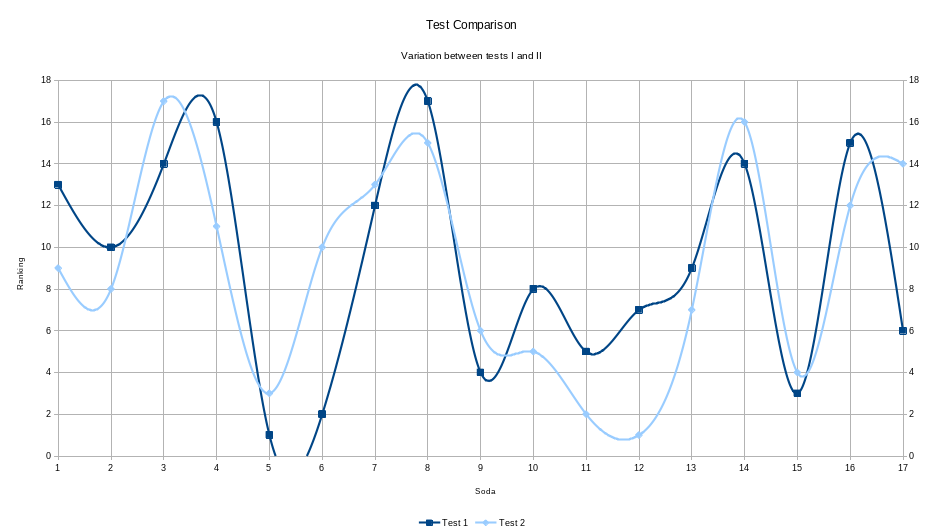
And it is not. As the graph shows the results of both tests are more or less consistently in the same ball-park and not all over the place. Naturally there are some variations, but that was expected with only two test runs.
We can also see that i.e. soda no. six has a bigger difference between the test runs that i.e. no. 9. Another graph where the sodas are ordered by rank shows this a bit better:
Soda 6 again clearly shows up as having come out of the second test better than the first one. Additionally number 17 is turned also out to be judged better the second round. In the first graph it was all the way to the rights, which made it a bit harder to discover.
The average difference between the two tests per soda is about 3 units.
We can have a look on to the difference per soda of the average also in a different way:
Here we can clearly see that soda 12, 8, 17 and 16 have the biggest variance of all sodas. There also seems to be a bigger range closer to the lower rank sodas, than to the higher once. Especially the last four sodas as well within the average difference of three units. There might be we trend towards the lower rank sodas that separates the higher rank drinks. Let us see:
Here we see the variation in percent compared to the total number of sodas. It is more visible now that bigger variations are are discovered in the lower ranks (between 3 and 14), while the absolute bottom three and top are relatively stable in their rank.
That’s also what I would chose as conclusion: There are at least three sodas at the very top and the very bottom during the tests:
Top |
Bottom |
|---|---|
08 |
05 |
03 |
11 |
14 |
15 |
To make the long story short: Next year I will mostly aim for these to buy and try to avoid the lower bottom ones. Objectively we identified the most likely best and worst Julebrus.